Friday, February 20, 2015

Confusing Contexts

A few weeks back during one of our previous classes, we had a brief discussion on what contexts we would choose to use in teaching fractions. Many of us mentioned food, baking, measuring time and distances, money. These we believed were things students knew about and had back ground knowledge on, and potentially things our students would find interesting or care about - who doesn't like food?

This past week during an observation, I realized more so just how important the context is that we choose to use. I was in a seventh grade classroom. The students were reviewing for their upcoming test the next day over percentages (comparing percents, fractions, and decimals, finding percentage change, what's the percentage of a whole?). I was walking around the classroom, helping students who had questions. Most of the students in the class seemed unafraid to ask questions if they were uncertain about something - which seemed to be a result of the sort of classroom the teacher had cultivated. Anyway, as I was walking around I had a girl ask me over to see if she was solving a problem correctly. The problem gave her the price of a good, the percent of a mark up on the good, and asked for the new price of the good after the mark up. When I asked her what she was thinking, she explained to me how she had solved the previous problem (given the price of a good, and the percentage of discount, find the new price). She asked if she would then solve this one in the same way - after all she was given a price and a percentage and asked to find the new price. So to her the two problems seemed very similar, if not the same. I asked her if she knew what "mark up" meant and she shook her head no. I helped to explain to her the concept and then she was able to solve the problem on her own.


Originally, viewing the problem, it sounded like the previous one. While she may not have known or simply had forgotten, not knowing what a mark up was, she made an assumption that felt logical to her so she could keep going and solve the problem. Luckily she had asked a question, but not all students will. On a test, she might have gotten points off, even though once she understood the situation she knew how to correctly solve it.

Context is important. We want to see what students have learned and understand, instead of whether they know what the term "mark up" means. We may think students know what a mark up is (it uses the word up, so wouldn't students think increasing?), but they may not. Lots of students haven't had jobs yet and are more familiar with ideas of sales and discounts, than the marking up of prices by suppliers. When using contexts, we need to be careful and ensure they are relate-able to students and that students understand them and any vocabulary or ideas that accompany it.

Monday, February 9, 2015

Proportion Sense

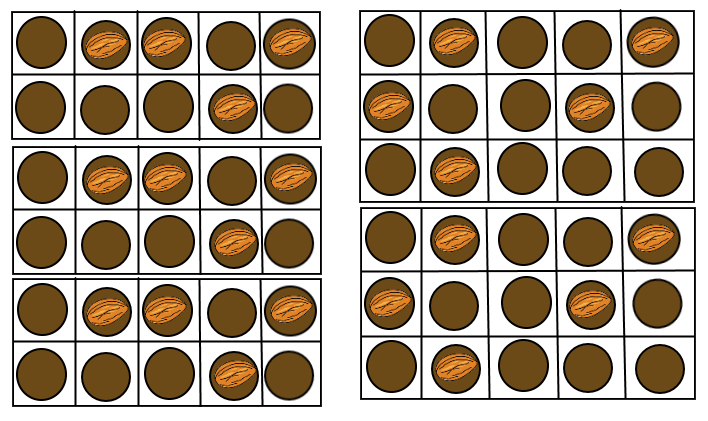
Recently in class we began discussing fractions. We began by looking and discussing proportions without the use of numbers. It seemed like it would be simple, but without the use of fractions at our disposal it became difficult.

We were given a picture of two boxes of chocolates(like below) and asked which one was more nutty?
It was difficult to stop yourself from using and comparing fractions - since we already have that knowledge. Our future students, however, will be just developing how to use fractions and relate them. Instead, we had to rely on the picture and ways in which we could manipulate it. What we ended up finding most helpful was the idea of buying enough of each box so you have the same number of chocolates and then comparing how many nuts each one has. An idea  that relates back to finding a common denominator. Once you had the same number of each, making a comparison between the two was logical.


However, after accomplishing this, when faced with another proportional problem we fell into mistakes. We were given a problem comparing mixtures of blue dye with water. Given certain a number of beakers of dye and water, we had to decide which would produce a stronger blue color. It was interesting to see how different we reacted to this problem. Many of us ignored the idea of getting to the same number of beakers and began to cancel out blue dye and water combos. The result was a false belief that the two mixtures shown below would be the same color.
We failed to take into account the ratio of water to blue dye. It was startling to find ourselves making this mistake.

These two activities really helped me to come to understand the importance of proportional sense. My future students will likely be making similar mistakes, but having a discussion on these ideas and working through proportions without numbers will be helpful. Introducing students first to proportions and making sense of the relationships between them will get students asking important questions:

  • What quantities are being compared?
  • What other factors do I have to consider? 
  • What roles do these variables play/what's their relationship?
    • How is it affecting the goal(if it's nuttier or more blue)?
Through this, students can begin to develop a sense of how to compare proportions and what to take into account. Then, when dealing with the numbers and fractions they should to able to reason if the answer they arrive at is a logical one or not. They can rely on asking questions to led them to the correct calculations and hopefully dealing with fractions will not seem as daunting.

Wednesday, January 21, 2015

The Human Number Line

One of my current classes is centered upon teaching middle school math - which looking back I now realize began a decade ago for me. Most of what and how I was taught, I honestly don't remember in much detail. However, I can recall that for the most part I was in my seat and taking notes - likely doodling as well. Maybe once in a while I remember forming groups, but really infrequently. 

During one of our past meetings as a class, we were introduced to the idea of using a human number line - a number line down the center/front of the classroom on which students could walk/stand. Our line was centered at zero and went from -15 to 15. As a class we illustrated by walking various equations and story problems. We played games that involved adding and subtracting of negative integers - trying to beat your opponent by making it to your end first (whether -15 or 15). Even as a college student it was enjoyable to work out how to play the games and interact with another in a different way. 


Instead of having students just sitting and taking notes, students can make connections between action/movement, visuals, and the math algebraically. For example, when given the problem 8-(-5), the student would begin on the number 8 facing the class, then turn toward the negative end of the number line (representing the subtraction) and then walk backwards (representing the negative number) 5 paces. The student would land on 13, the solution to the problem. In the process, students will begin to notice that subtracting a negative (though different) results in the same solution if you were to have added a positive 5. Other students in the classroom not walking out the problem can follow by using a printed out number line paired with an object to move (like a chip or plastic cricket). 

In addition, number lines are useful and helpful later on in students mathematics careers. Allowing them to become familiar with them and their usefulness, just gives students another tool with which to work. Such as later encounters with inequalities and graphing the solutions. 


Doing the same old, same old, is boring. The use of the human number line seems like a good way to break this. Students are up and moving, and shown through multiple modes of representation - connecting ideas and figuring out what works best for them.

Monday, December 1, 2014

All of the Lights

One of my family's favorite Christmas movie is National Lampoon's Christmas Vacation. So since it's getting close and it's that time of the year, I thought I would look into something Christmas related. This weekend, since the weather was nice (no more snow and not too cold!), my family dug out the Christmas lights to put them up. And it got me thinking of that movie and all those lights. How many and how much would it cost to decorate a house as done in the movie - the entire roof and all around the entire sides.


First, I went to find out what sort of lights were used. Based on a picture in a movie, they're larger than the sort I'm used to. So then I searched Christmas lights. I know that there are all sorts of places to buy lights but I choose Home-Depot. The lights cost $8.48/each for a strand of 25 lights at a length of 25 feet. You can however only connect at most 2 sets. But I'm guessing by the looks of it with any lights you wouldn't be able to create that long of a strand. So we're just going to assume that we can attach them all together no matter.


So now how to figure out how many strands are needed. After a little searching, hoping to find the house dimensions (and then go round trying to figure out how many strands), I was able to find that house was decorated with 25,000 lights! That's a ton and no wonder. So divide that by the nice easy 25 lights per strand and you would need 1,000 strands of lights. And based on the website, you'd have to travel to several stores to pick them up - the one near me only has 20 on stock. These lights being bigger than usual, already cost a lot. Multiplying the cost of a strand at $8.48 by the number of strands, it ends up costing $8480.00 dollars. No thank you. I could pay to study abroad instead!

And the length of all those strands, at 25 feet per strand ends up being the same as the number of lights - 25,000 feet.


So then I thought: how tall of a tree would you need to use that many lights? I'm going to use a cone to represent a tree to find this out. Since lights go around the tree, I'm going to look at the surface area of a cone minus the base: pi*r*l. The variable "l" of the cone represents the slant height, which in terms of height equals sqrt(h2 + r2 ). So our formula becomes: pi*r*sqrt(h2 + r2 ). Just looking at my own tree, the height is about 3 times the radius of the tree. Using this I can narrow the formula down to having only one variable, height: pi*h/3*sqrt(h2 + (h/3)2 ). Now to simply the equation a bit:

= pi*h/3*sqrt((4h/3)2 )
= pi*h/3*4h/3
= pi*4h2/9

To make things simple, just like the house we'll cover the entire tree with lights! Which I think would hurt to look at up close haha. The width of the light strands is about 2 inches or 1/6 of a foot, so the area of all the light strands is  feet squared. Setting this equal to the surface area and solving:

4166.67 = pi*4h2/9
37500 = pi*4h2
2984.15h2
54.63 = h

So the height of the tree is about 55 feet. A little too small to be the tree at Rockefeller Center (69 to 100ft). If the spacing between the lights was increased from nothing to something, the height of the tree would just continue to grow. So again, like I thought, I'm going to pass. I'd rather keep with tradition and continue to put up the fake tree and string a few lights.


Tuesday, November 25, 2014

A Jumble of Geometry

Recently in class, we began with some talking points - questions related to geometry to spark discussion. One of the questions asked, "From the diagram given below, you can find the measure of angle D":
After a brief look at the diagram, the answer was clear: no. The measure of angle D can not be found because the diagram does not tell have parallel lines - if this was given the answer would be yes! As a follow up, a new diagram was given. Below I will outline my steps in the process of solving for each of the 4 angles presented.

The Process


The first thing I noticed when looking over the above diagram was the 44 deg. angle at the bottom. Since this time the lines are parallel and recalling that opposite side exterior angles are congruent, I knew the value of A is 44 deg. as well. At this point, recalling the vertical angle theorem, I was able to fill in 2 other 44 deg. angles(in blue).
After writing in the values, I noticed the triangles at the top and bottom of the diagram. They now had 2 of there 3 angles filled in. Knowing that the angles in a triangle always add to 180 deg., I was able to find the third angle in each:
180 - (12 + 44) = 124
180 - (44 + 30) = 106

Once those angles were filled, my focus became on B. By the vertical angle theorem would also we 124 deg. And by the same theorem I was able to find another angle of 106.
If you can't tell, the tiny orange dot in the small triangle represents the other 106.
Next, I looked to solving C, because I felt like if I'm going in order thus far I should keep with it. But as I looked at the diagram, D felt like the clearer next step. All I would have to do is find all the angles of the little triangle and I'd be a step away from finding the measure of D. I recalled that angles on the same line add up to 180 deg. This allowed me to find the angle beneath 112 deg, because they are on the same line - so the angle must be 68. By the same reasoning I was able to find another angle of 68 deg.
Now there's a tiny pink dot in the tiny triangle. 
Again, I know all the angles of a triangle add up to 180 degrees. So 180 - (106 + 68) equals the measure of the third angle, which is 6 deg. Then I noticed that the measure of angle D with the angle I just found makes a circle, which has an angle of 360 deg. So using this fact and the found angle, D is 354 deg.
So now I finally had to face C. This one took me a minute. As I looked at the diagram, I kept thinking "how will I find C?" and wishing "if only I could find the measure of the angle that with C results in 360 deg". So how could I find this angle? The shape was irregular and I didn't know anything extra about the lines around C (no parallel lines to be had). I kept thinking, if only I could somehow break the shape in triangles and find other angles that could lead to C. I wished the shape was regular, then maybe I could find the sum of the angles and then find C. As I thought about this I realized that the regularity of the shape was irrelevant. This shape was five sides, so it's a pentagon, and pentagons (all and any) have 540 deg as the sum of their interior angles! 
Since I now have 4 of the 5, finding the fifth became extremely simple: 540 - (124 + 22 + 68 + 52) = 274. To find C, all I had to do was subtract this angle from 360. So C ends up being 86 deg.

Thoughts:


For not having done high school geometry in a while, I felt good about working through this problem. I especially liked the way in which it seems a little daunting (all the lines and angles and shapes) but as you dive in, you realize that each piece of the puzzle isn't too bad. It was also helpful in using several different theorems that I was taught in high school geometry to figure everything out. While the pentagon through me off a little in my search for C, I enjoyed that aspect. It was nice to struggle and face a minor challenge along the way - once reaching the solution, how obvious it now seemed! I think it would be fun to present the problem to high school students, since a lot of the knowledge and understanding required for the puzzle they are in the process of learning. And because it's a process, that one thing leads to the next and has more purpose than simply filling in the blank for one question, students could get a lot out of it - applying the skills they are gaining and diving into critical thinking and problem solving!

Thursday, October 23, 2014

Visual Mathematical Laws

Inspired by the following blogpost, I decided to make my own visual representation of mathematical laws. Art being my tied for favorite subject with math, the idea of visual representations sounded not only fun to create but potentially really helpful for visual learners. The visual representations take away the daunting idea or confusion variables bring to many students. If students are confused about variables or just have a general dislike, with the visual representation they are still receiving the same information just in a more understandable way. Along with this, students should be brought to discover or shown how the laws have come to be, since understanding the laws is more important and helpful than just remembering them.

In addition, to me, the visual representation is more interesting. Students see numbers and variables all the time in their math classes - of course! Color, on the other hand, not so much. So maybe students will have a tendency to recall the laws better because of the uniqueness with which they were presented. Plus it's always fun to see math and art come together! - even if in such a small way.

Through the process of making the laws, I became more aware of how some of the laws work. Before I just took it for what I was told, memorizing but not really seeing the connections. The colors helped me to make the connections and clearly see where each piece is coming from. It's difficult to say if I would personally ask my students to create their own - it might take some students a lot of time and they may not see the purpose in it. I would however in going over the laws with a class encourage them to use colors in place of the variables and have a poster of the laws in this way displayed in the classroom.

So for mine, I decided to link it to those seen in the blogpost(which focused on laws of exponents) and visually represent the laws of logarithms :)
They are as follows:

  • Logarithm to Exponential
  • Canceling Exponentials (2nd and 3rd)
  • Product
  • Quotient
  • Power
  • Changing Base
  • BONUS!


Saturday, October 11, 2014

Working with Algebra Tiles

After using them in class and reading an article advocating for the use of algebra tiles in classrooms, I was left with two main questions.

 The first, deals with completing the square. The article gave a long list of things the tiles could be useful to help teach. Having been tutoring for awhile, I've realized that many students do not know what it is to complete the square or get confused about how. So I wanted to put it to the test and see how the tiles would be able to show the concept of completing the square.

I did a quick Google search to find some problems that require completing the square:

  1. x^2 - 4x + 6 = 0
  2. -x^2 - 2x - 5 = 0
  3. 4x^2 + 4x - 3 =0
Then I completed the square to find the solution, so I could compare when working with the algebra tiles.
  1. (x - 2)^2 + 2 = 0
  2. -(x + 1)^2 - 4 = 0
  3. (2x + 1)^2 -4 = 0
So I began, and at first, I was confused. I collected all the tiles I would need, but somehow could not form a rectangle/square. It simply was not possible.
After a moment, I realized, to complete the square I will have to create a square with the tiles. So first, after placing the x^2 tile, you have to divide the x tiles evenly on either side.
Then I filled in the units to complete the square, with 2 of the six leftover. So when writing the solution you get (-x + 2)^2 + 2 = 0. Which is equivalent to the solution above. As I solved the others, I realized it got easier as I went along. You just have to be careful with the units (that the total tiles is the total units you had in the original equation). Both ways, visual and symbols seem like fine ways to teach it. It seems like it would be helpful for visual/struggling learners and interesting to others. But potentially a waste of time for students who already grasp the idea symbolically, if they must do a lot of work using the tiles.

Here are the visual representations of the other 2 equations:


My second question, was if algebra tiles could make realizing if a given binomial can not be factored easier? So again, I Google searched and found two equations that could not be factored and got out my tiles.
  1. x^2 + 2x + 5 = 0
  2. x^2 + 4x + 1 = 0
After setting up both, the answer is yes! If the equation can not be factored, you will have more or less units than what is necessary to create a rectangle with the tiles. Since students are sometimes asked to factor an equation, or say if it can not be factored, this method seems really helpful. Students can see the solution quickly, whether it can be factored or not. It also allows students to pay attention to the units of the equation when deciding if something can be factored. When they face larger equations, which the tiles would not work well for, students know where to look.


So both questions resolved, I recommended the use of Algebra tiles. The algebra tiles help to introduce ideas of factoring (which can feel and seem abstract) in a more concrete way. Students can see, visually, why something works and how to fix the problem. They become more comfortable with the ideas of factoring and gain insight into recognizing when things can and cannot be factored. So hopefully, as a result, factoring will not feel like a daunting task, but an achievable one.